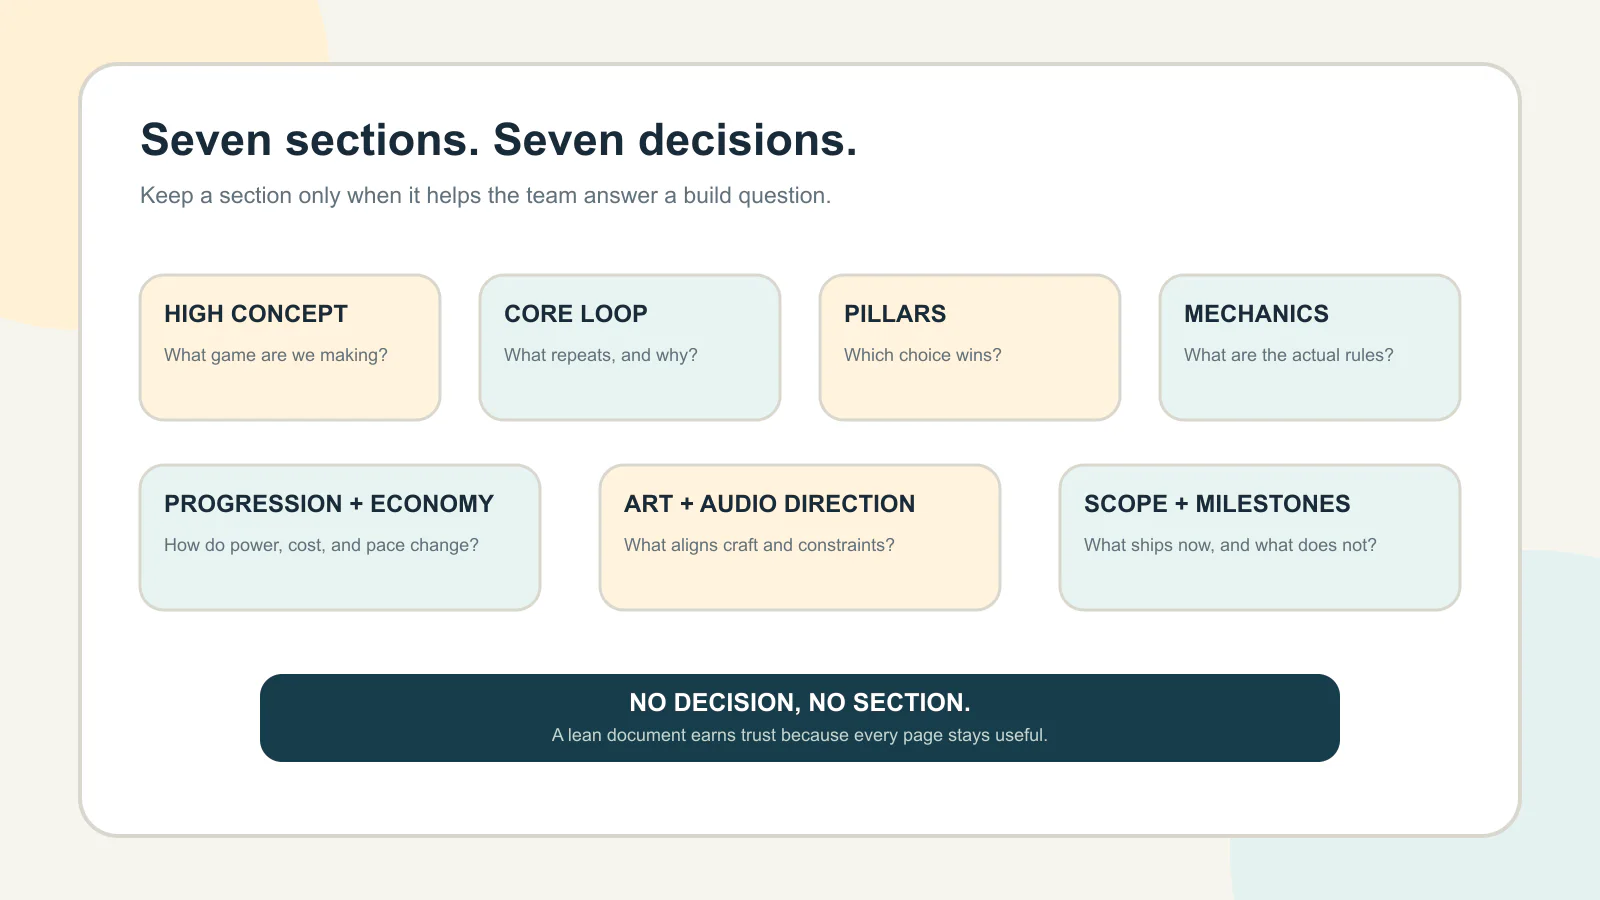
How to Document Systems, Economies, and Progression
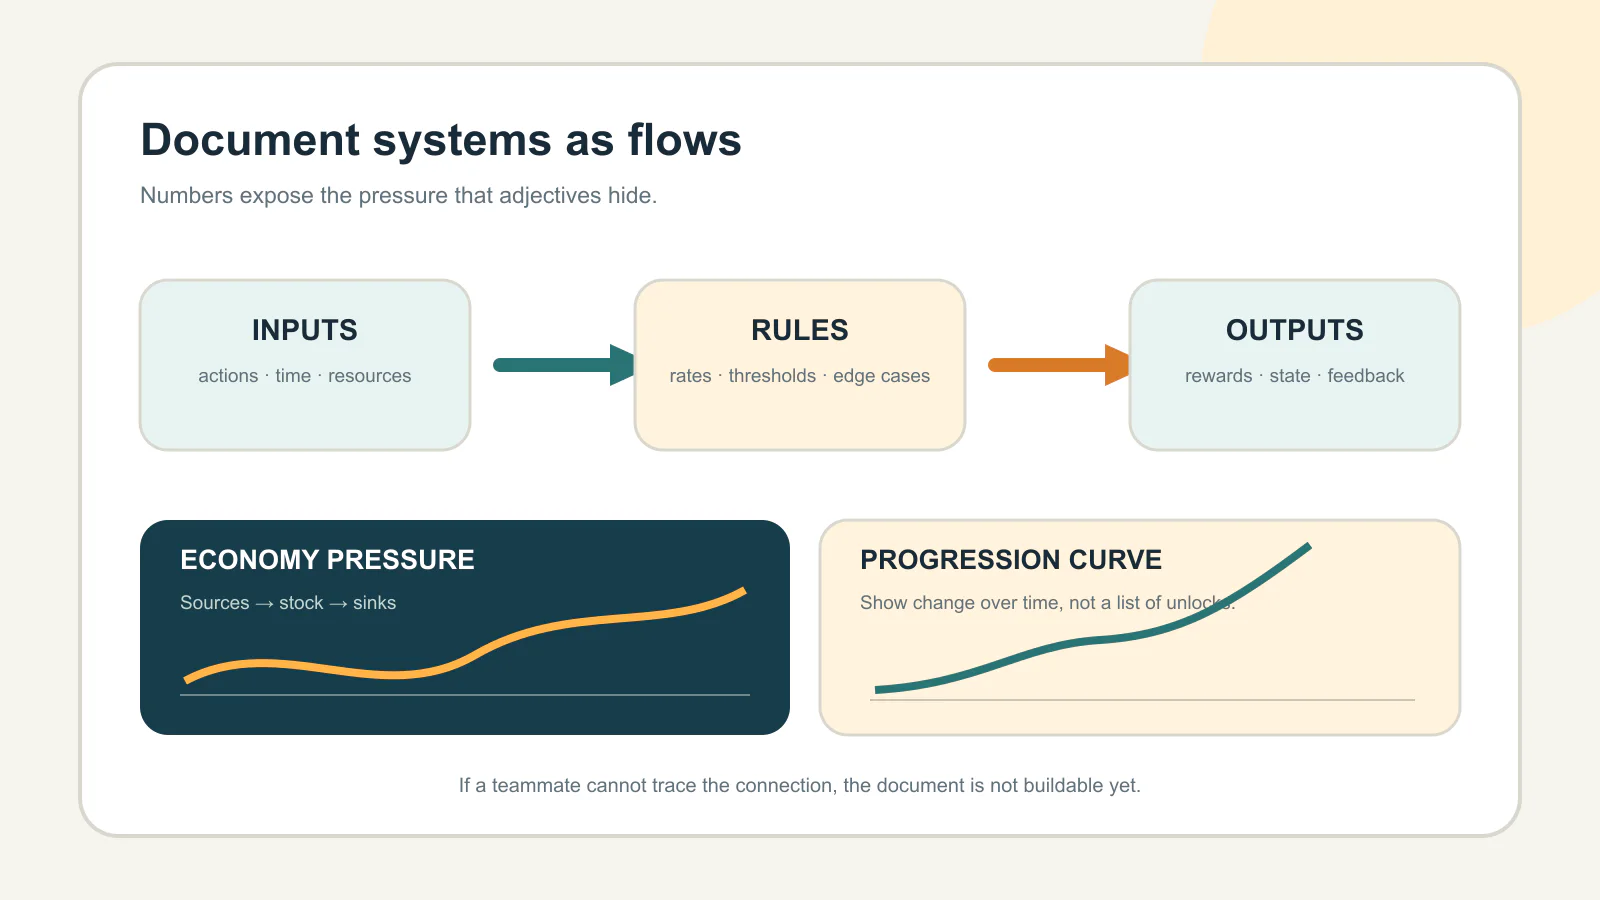
Image: Game Design Document
High concept and core loop are the easy parts of a design doc. The section where most GDDs fall apart is the systems: the interlocking rules, the in-game economy, and the progression curve. This is where vague writing does the most damage, because a programmer or balance designer cannot build “a satisfying upgrade path.” They need to know what feeds what, how numbers move, and when the player feels the change. Document these three areas well and the rest of the doc almost writes itself.
This guide gives you a repeatable structure for each, with the level of specificity that turns prose into something buildable.
Documenting Systems by Their Connections
A system is not a paragraph of description; it is a set of inputs, outputs, and rules that connect to other systems. Write each one so a stranger could trace how it works.
For every system, capture:
- Inputs. What feeds it? Player actions, resources, time, other systems.
- Rules. What transformation happens? The logic, thresholds, and edge cases.
- Outputs. What comes out? Rewards, state changes, unlocks, feedback.
- Connections. Which other systems does it touch, and in which direction?
That last point matters most. Games break at the seams between systems, not inside them. A crafting system that quietly inflates the economy is a connection problem, and you only catch it if the doc makes connections explicit. A simple dependency list or diagram, even a rough one, is worth more than three pages of description.
Documenting the Economy With Numbers
An economy section written in adjectives is useless. “Resources should feel scarce but fair” tells the team nothing. Write sources, sinks, and rates instead.
Lay it out as a table so imbalances jump out:
| Element | Detail |
|---|---|
| Sources | Where currency and resources enter (loot, quests, salvage) |
| Sinks | Where they leave (crafting, repairs, upgrades) |
| Earn rate | Roughly how much the player gains per session |
| Spend rate | Roughly how much a typical upgrade or repair costs |
| Target balance | Whether the economy should trend toward surplus or scarcity |
Even rough numbers beat none. If salvage comes in at ten units an hour and a key repair costs fifty, the doc has just told your team the pace of a core decision. In a sci-fi survival design where a mech constantly degrades, that ratio between what the player earns and what survival costs is the entire tension, so it belongs in the doc as figures, not vibes.
Documenting Progression as a Curve
Progression is how the player grows over time, and time is the key word. Describe it as a curve, not a list of unlocks.
- Define the axis. What increases? Power, options, difficulty, or narrative access.
- Sketch the shape. Does power climb steadily, spike at milestones, or flatten late? A rough graph communicates instantly.
- Mark the beats. Note the moments the player should feel a jump: first upgrade, first tough boss, first big unlock.
- Pair growth with challenge. Show how difficulty rises alongside power so the curve stays tense instead of trivial.
The goal is that anyone reading can predict how hour five feels compared to hour one. If they cannot, the section is not done.
Tie the Three Together
Systems, economy, and progression are not separate chapters; they are three views of the same machine. The economy fuels progression, progression unlocks systems, and systems generate economy. When you document each one, note where it hooks into the other two. That cross-referencing is what turns a pile of sections into a design a team can actually build.
FAQ
How precise do the numbers need to be this early? Precise enough to show intent and catch obvious breaks. Placeholder numbers you plan to tune beat no numbers, because they reveal the shape of your decisions.
Should I use diagrams or text? Both. Diagrams show connections and curves at a glance; text captures rules and edge cases. Use each where it is stronger.
What if the systems keep changing? They will, which is why these sections belong in a living, modular doc. Update the affected page when a system changes and note its connections so ripple effects stay visible.
Key Takeaway
Document systems by their inputs, outputs, and connections. Show progression and economy with numbers and curves, not adjectives, so the team can build them.
Sources: Game Design Skills, Nuclino, Hi3D
gddsystemseconomyprogressiongame design